
GEBHARDT Automation GmbH
GA BlueVisual - Process Visualization Software
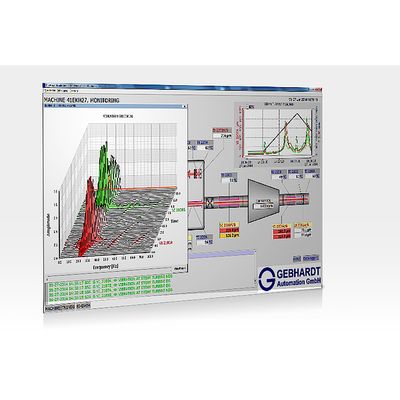
Process visualization including vibration analysis. GA BlueVisual is a local process visualization that supports—in addition to other capabilities of GA TurWin—also the basic functions of machine monitoring (MMS – Machinery Monitoring System or CMS – Condition Monitoring System). The high-resolution vibration monitoring data can be recorded and visualized for this purpose. The display supports frequency spectra, orbits, PT and PV diagrams, and also visualization as high-resolution trends, synchronous or asynchronous). Orbits and frequency spectra in the form of waterfall diagrams can provide a good insight into changes over time.
Most popular related searches
vibration monitoring data
vibration monitoring system
vibration monitoring
vibration analysis
gas monitoring system
machine monitoring
vibration data
gas monitoring
gas analysis device
analysis system
- direct connection to GA vibration monitoring systems, without any additional hardware
- simple condition monitoring and analysing for GA systems
- high-resolution data recording of vibration signals
- Support for different, open communication protocols