

Pie Medical Imaging B.V. software
Cardiac Diagnostics - Caas MR Solutions
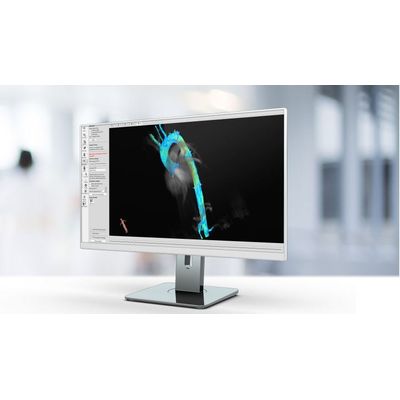
Caas - Model MR 4D - Complete Flow Assessment Software
Caas MR 4D Flow is specifically designed to extract relevant information from 3D phase-contrast (PC) MR images, within a few clicks. Based these phase-contrast images, two pioneering 4D Flow modules are offered to perform a complete flow analysis that can aid in reading and interpreting cardiovascular MR images and assist in planning the time and type of an intervention. These two modules include a module to analyze vessels, from the aorta up to smaller vessels in for example the kidneys (Caas MR 4D Artery), and a module to analyze the heart valves in terms of regurgitation fraction (Caas MR 4D Heart).
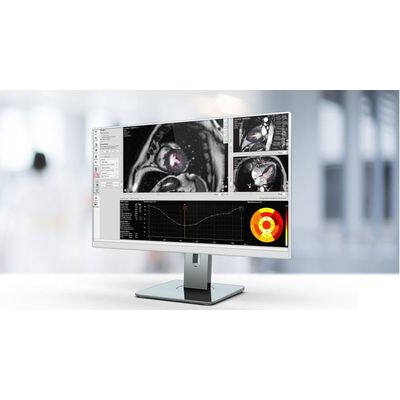
Caas - Functional MRI Images Analysis Software
Designed for the imaging specialist, Caas MR Functional Analysis assists in functional analysis of the heart. The endocardial and epicardial wall of the ventricle can be automatically segmented on short axis images. Long axis images can also be used for segmentation. Ejection fraction, End Diastolic (ED), and End Systolic (ES) volumes are accurately calculated. Wall results in terms of wall motion, wall thickness, and wall thickening can also be obtained.
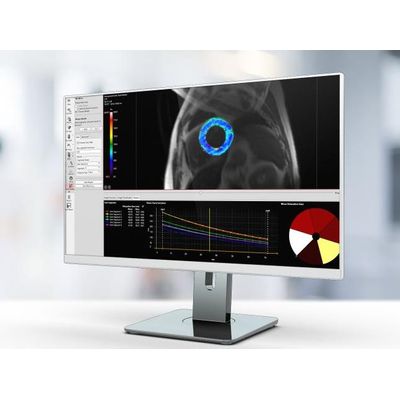
Caas - Model MR - Tissue Characterization Software
Caas MR Tissue Characterization includes three workflows: Viability, First-Pass Perfusion, and Tissue Mapping. Differentiate between viable and non-viable tissue using regional infarct classification based on delayed-enhanced MR images. Assess myocardial edema based on T2-weighted images. By combining segmental infarct and edema areas, salvageable areas in the area at risk can be identified. Analyze rest and stress perfusion image sets side by side in the first-pass perfusion workflow to determine myocardial perfusion. Tissue mapping by discriminating between T1 and T2 tissue contrast is a unique strength of MRI. It allows the analysis of T1, T2, and T2* relaxation values. Relaxation values are translated into a color map for easy visualization of affected tissue. Visualization of T1 relaxation values is supported for look-locker and modified look-locker sequences.