data-visualization Downloads
5 downloads found
BESA MRI is software to generate individual head models (BEM / FEM) that can be used for EEG and / or MEG source analysis. BESA MRI also allows co-registration of EEG / MEG data with individual MRI data, and visualization of dipole solutions generated in BESA Research in the individual anatomy. BESA MRI is the first software that offers an easy, intuitive interface with an integrated workflow ...
Combine eye tracking, physiological measurements, and emotions to provide fast and rich UX data insights and visuals with ...
Sequence, Direction and Speed. FLOW 800 from ZEISS – Vascular Blood Flow Dynamics, Realized. ZEISS FLOW 800 is a unique analysis tool generating blood flow dynamics data by identifying detailed vessel blood flow intraoperatively. Transformation of ZEISS INFRARED 800 video data into visual maps and diagrams support fast identification of AVM feeding arteries, nidal vessels and draining veins ...
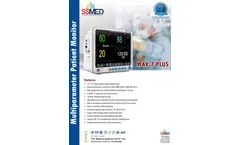
12.1 "TFT high tesolution medical grade monitor. Standard Parameters: 5 leads ECG, SP02, NIBP, RESP, TEMP, HR, PR etc. Multi-display large font. Standard full lead, trend display of 72 hours. OxyCRG. ST segment & Arrhythmia analysis. 720 hours monitoring data storage. Adjustable audio & visual alarms for high Flow monitoring of all parameters. Built-in removable rechargeable hiliium-ion ...
The application of PIV in research and industry is widespread,due to its ease of use and accurate data representation.As easy and intuitive as PIV is, it involves many cross-discipli-nary challenges, from classical optics and imaging to the useof dedicated state-of-the-art digital electronics and lasers.Partnering with Dantec Dynamics brings you a wide range ofproducts to select ...


